Advanced Charts
This section enables you to use detailed descriptors to chart the performance of a security over a variety of time periods. This section uses technical indicators to analyze charts. Technical indicator tools are used to determine trend, market sentiment, and various buy and sell signals.
Chart Style: Select one of the following styles to chart the performance of the selected security.
• OHLC
• HLC
• Mountain
• Linear
To add an upper indicator:
1. Click the Upper Indicators drop-down box to display a list of upper indicators.
2. Select the desired indicator. Selected indicators are represented with a checkmark beside the indicator name.
3. Repeat steps 1 and 2 to add another indicator. You can select up to 4 upper indicators.
The following lists the upper indicators:
Once you have selected an indicator, the indicator name appears at the top of the chart. To access a description of the indicator, click on the indicator tab. A small window is displayed with a description of what the indicator is and how to customize it.
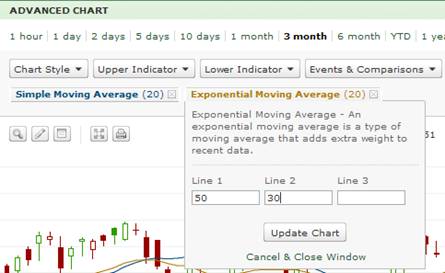
You can modify the EMA and SMA indicators by changing the numbers in Line 1, Line 2, or Line 3 field(s). The numbers entered indicate the number of past time periods to include in the calculation. For example, in the Exponential Moving average (EMA) window, if you enter 30 in the Line 2 period field, the past 30 time periods will be taken into account when calculating the value. If you are viewing a one-year chart, the
To delete an indicator, click the delete icon beside the indicator name.
Lower indicators are made up of oscillating indicators and volume-base indicators. Lower indicators are plotted below the price chart.
Volume
Volume + MACD
Mass Index
MACD
Rate of Change (ROC)
Relative Strength Index (RSI)
Slow Stochastic
Fast Stochastic
Williams %R
To add a lower indicator:
1. Click the Lower Indicators drop-down box to display a list of lower indicators
2. Select the desired indicator to add it below the main chart
3. Repeat steps 1 and 2 to add another indicator. You can select up to 6 lower indicators.
When an indicator has been added to the chart, the indicator name appears at the top of the chart. The following lists the lower indicators:
• MACD
• Momentum
• Relative Strength Index (RSI)
• DMI
• Volume
• ADX
To delete an indicator, click on the delete icon to the far right of the lower chart.
Select an event to chart or select a comparison:
• Earnings
Select a company or index comparison:
• Compare to Company. You can make up to 6 comparisons of companies or indexes to be displayed together with the chart, dividends, earnings, and splits/consolidations for a given symbol.
• Symbol: Enter the symbol for the company to which you want to compare. Select Canada for a Canadian company, U.S. for a company in the U.S.
• Compare to Index: Select an Index to which to compare the security. You can make up to 6 comparisons of companies or indexes to be displayed together with the chart, dividends, earnings, and splits/consolidations for a given symbol.
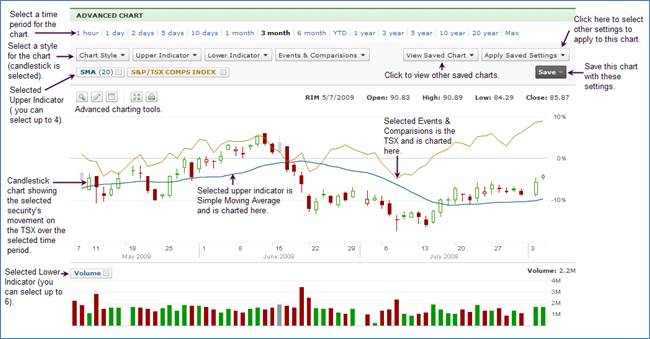
 Saving Charts