Technicals
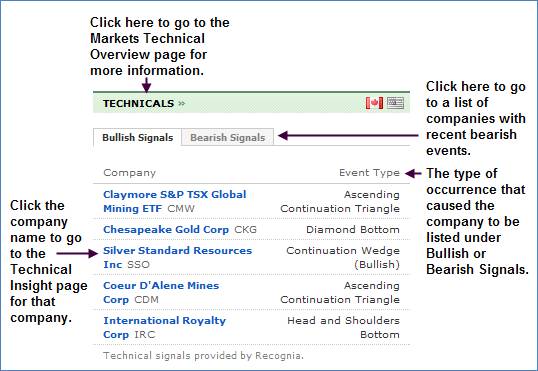
This section provides information on different companies
and their events that are classified into Bullish Signals or Bearish Signals.
Click the Canadian flag  for
information about technical events from Canada (this is the default). Click the
U.S. flag
for
information about technical events from Canada (this is the default). Click the
U.S. flag  to display U.S. technical
events. Clicking a flag in the Technicals section only changes the setting for
this section. To globally change the flag on this page, click a flag in the top
right corner of the page.
to display U.S. technical
events. Clicking a flag in the Technicals section only changes the setting for
this section. To globally change the flag on this page, click a flag in the top
right corner of the page.
If you mouse over the name of the company, a small window detailing the company’s current share price, today’s change, volume, and a chart of today’s trading. You can also chart a month of a year’s worth of performance. You can also choose to Buy, Sell, or add this security to your portfolio.