Current Distributions of Analyst Estimates
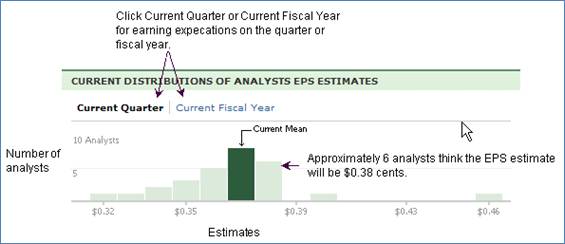
This section displays how the quarterly or annual analysts estimates of EPS earnings are distributed for a selected security. The Y axis displays the number of analysts and the X-axis contains the estimated EPS earnings. A bar chart plots the distribution and the current mean is automatically calculated and highlighted in green. The quarter and year that are displayed depend on the company’s fiscal year as well as the current month of the year.