EPS Consensus Expectations
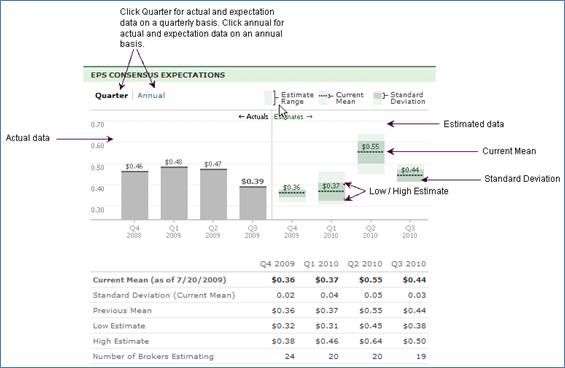
The EPS (Earnings Per Share) Consensus Expectations section displays quarterly and annual expectation information to provide you with data about how a company has done, is doing, and might be doing in the future.
For Quarterly and Annual information, the following is listed:
For quarterly information, the chart shows current actuals for the 4 most recent historical quarters on the left and the estimated data for the next 4 forward-looking quarters on the right side of the chart.
For annual information, the chart displays the past 4 years of actual data on the left and then estimates this year, the next year, and one year after that on the right side of the chart.
For quarterly and annual information, the table below the chart lists the following:
• Current Mean (as of today’s date)
• Number of Brokers Estimating
