Market Statistics
This section provides valuable insight into the performance and movement (of individual companies) within the major North American indices:
• TSX Comp
• TSX Venture
• NYSE
• NASDAQ
• AMEX
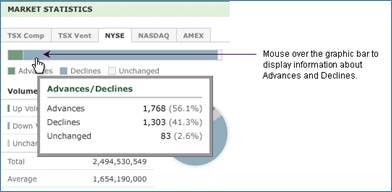
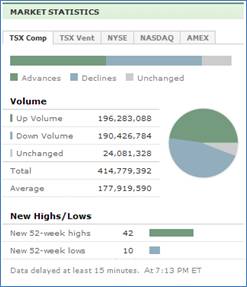
Each index has its own tab. If you select an index, the colour-coded bar graphic demonstrates the number of companies advancing or declining in price and those that remain unchanged. You can mouse over the graphic to display the actual number of companies whose stock went up or down or remained unchanged in both number and percentage format.

Volume information about the selected exchange is shown in a colour-coded pie chart with statistics about the amount of Up Volume, Down Volume, Unchanged volume , Total Volume, and Average Volume for that market.
Index-specific high and low information over a 52 week period is displayed using a colour-coded bar.
