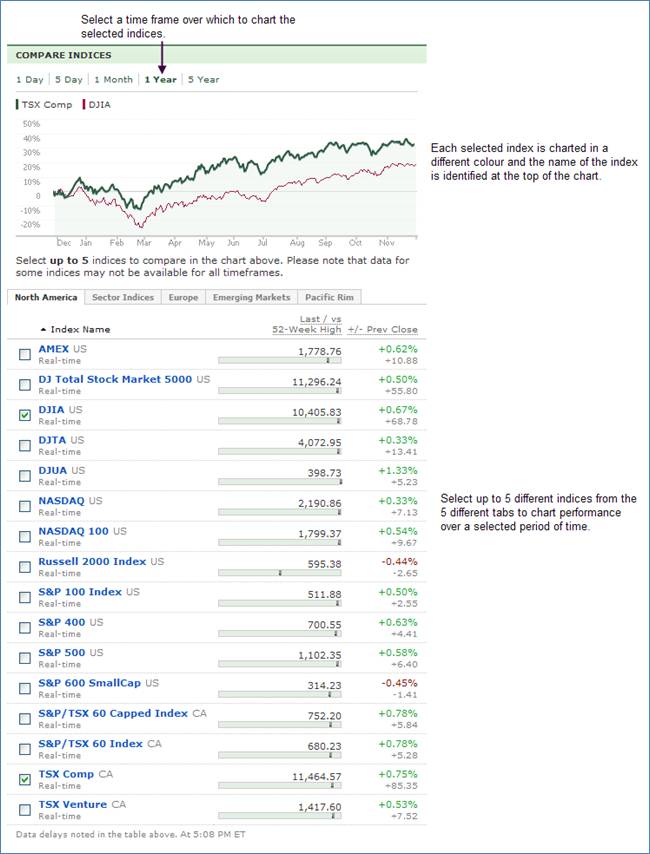
Compare Indices
This section enables you to compare up to 5 different indices over the following time periods:
• 1 Day
• 5 Days
• 1 Month
• 1 Year
• 5 Years
Selecting Advanced Charts takes you to the Index page for the first index selected. This page displays quote details and a chart for the selected index. The default index page is the TSX.
You can select up to 5 different indices from the following tabs:
• North America
• Sector Indices
• Europe
• Emerging Markets
• Pacific Rim
Each tab contains a listing of all indices and country for the market selected. When you select a tab, the indices are displayed in a table below the chart. It lists all indices associated with that tab, the country in which the indices are located, a graphic bar to show how the last price sits in comparison to 52-week high/low, and the percentage and dollar change in price. The percentage change is displayed in either red (negative change) or green (positive change). The dollar change is displayed in grey with a plus or minus sign indicating gains or losses. You can sort the information in all columns. The Index Name column is sorted by alphabetical order, data columns are sorted by ascending or descending values.
When you select various indices, each index is displayed on the chart in a different color with a colour bar and the name of the index at the top of the chart. If you do not select an index, the default indices are the TSX Comp and DJIA indices.