Sector Analyzer
This section displays sector comparison information based
on selected criteria to help you visually understand the value of Canadian and
U.S. sectors. Click the Canadian flag  to display Canadian sectors (this is the
default). Click the U.S. flag
to display Canadian sectors (this is the
default). Click the U.S. flag  to
display U.S. sectors. Clicking a flag in the Sector Analyzer only changes the
setting for this section. To globally change the flag on this page, click a flag
in the top right corner of the page.
to
display U.S. sectors. Clicking a flag in the Sector Analyzer only changes the
setting for this section. To globally change the flag on this page, click a flag
in the top right corner of the page.
For Canadian sectors, you can choose to make the following comparisons:
• P/E Ratio vs. Price to Book A ratio used to compare a stock's market value to its book value. It is calculated by dividing the current closing price of the stock by the latest quarter's book value per share.
• Earnings Yield vs. Revenue Growth (MFRY)
• Earnings Yield vs. Earnings Growth
For U.S. sectors, you can choose to make the following comparisons:
• P/E Ratio vs. Price to Book
• Earnings Yield vs Revenue Growth (MRFY)
• Earnings Yield vs. Earnings Growth
• Profit Margin (TTM) vs. Profit Margin (5YrAvg)
• Revenue Growthvs. Profit Margin
• Revenue Growth vs. EBITD Yield
You can also select the following time periods for either sectors:
• Today’s Change
• 1 Month Change
• 1 Year Change
Once you have chosen the appropriate comparison and size, click the Redraw button or press Enter. If you click on a sector bubble, you are taken to the Sector Overview page for that sector.
The following is an example chart.
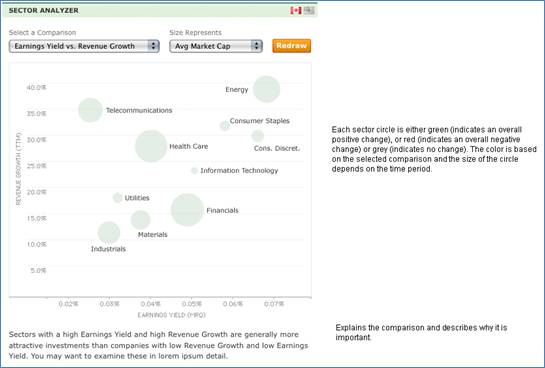
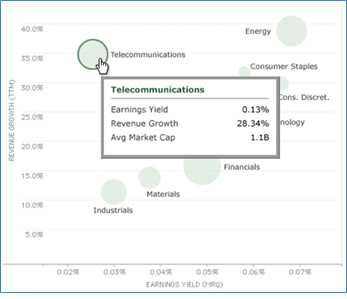
Mouse over a sector to see the following information. The data displayed in the hover depends on the comparison selection and on the size selection. The hover information is related to the selections in the “Select a Comparison” and “Size Represents” dialogue boxes. Click on that sector to go to the Sector Detail page.
See also