ETF Charts
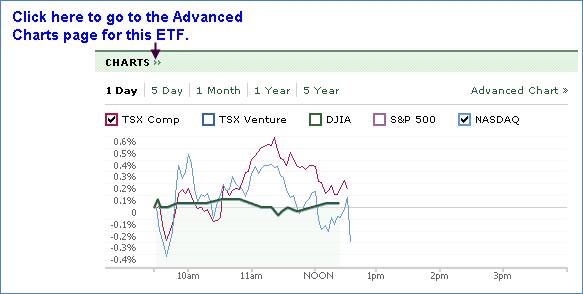
This section enables you to chart the selected ETF against up to 5 indexes:
• TSX Comp
• TSX Venture
• DJIA
• S&P 500
• NASDAQ
You can compare the price variation over the following time periods:
• 1 Day
• 5 Day
• 1 Month
• 1 Year
• 5 Year
Note: If the indices boxes are not checked, it is a price chart. If one or more boxes are checked to do a comparison, the chart changes to %.